Following yesterday's article one reader made the following observation; Liverpool are no closer to the team in No.1 position now than they were when Dalglish took over as manager.
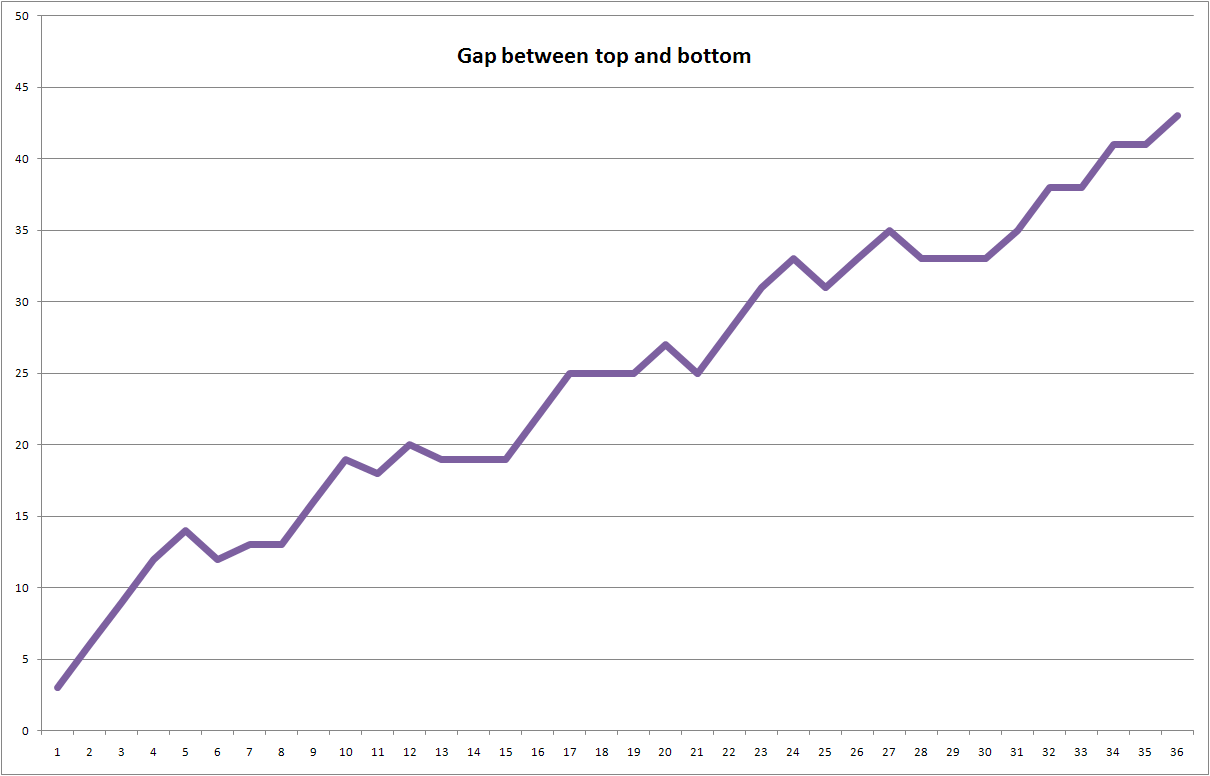
Indeed after 20 games Liverpool were 19 points off top spot, and are now 18. The graph below shows the difference between Liverpool's points total and the team in top spot (Manchester United from fixture 14 onwards) over the season. The vertical axis has been reversed to show the gap getting smaller as moves "up".

The graph shows that Liverpool were only able to close the gap between themselves and the team at the top of the table on 6 occasions throughout the season (3 under Hodgson and 3 under Dalglish). Clearly closing the gap on teams above you relies on them dropping points, something I'll come to later.
So you might argue that Liverpool's resurgence has been enhanced by other teams' poor form (i.e Tottenham).


However I intend to show that a) while Liverpool are essentially powerless to prevent the success of clubs above them, they were successful when the opportunities to do so arose and b) due to the fact that teams, by and large, get further from one another over the course of the season; an 18 point gap after 36 games is considerably smaller than a 19 point gap after 20 games.
Obviously it's not enough for Liverpool to win their own games to close the gap, they're reliant on the teams above them to drop points. On the occasions Liverpool have had opportunity to impact this directly (when playing against those teams), they have performed very well. If you look at a the mini-league containing the teams currently occupying positions 1-6; if Liverpool win the final game in the series against Tottenham (on Sunday) they'll go top on goal difference. (I got this data using http://www.statto.com/football/stats/england/premier-league/2010-2011/table).

Obviously it's not enough for Liverpool to win their own games to close the gap, they're reliant on the teams above them to drop points. On the occasions Liverpool have had opportunity to impact this directly (when playing against those teams), they have performed very well. If you look at a the mini-league containing the teams currently occupying positions 1-6; if Liverpool win the final game in the series against Tottenham (on Sunday) they'll go top on goal difference. (I got this data using http://www.statto.com/football/stats/england/premier-league/2010-2011/table).

Only 2 out of the 6 times Liverpool closed the gap on the team in first place was it when they beat that team (Chelsea in November and Man Utd in March), so I'd say they were pretty unlucky on the 2 other occasions they defeated a member of the top 6.
With regards to my point that "an 18 point gap after 36 games is considerably smaller than a 19 point gap after 20 games"; you can see on yesterday's final graph, that teams, early on, are very clustered together and become much more dispersed as the season goes on. This point is also demonstrated by the following graph, this shows the progression of the standard deviations of teams' points total across the season:

So my argument is that a points difference in more clustered division is actually considerably "larger" than a similar points difference in more widely spread division, where the gaps between everyone are larger.
Next time I'm going to look at a different impact of new managers - at Newcastle United.
Follow me on Twitter: @lewistong
No comments:
Post a Comment